Difference between revisions of "Weather and solar resource evaluation"
(Created page with "Category:Site evaluation") |
|||
| (40 intermediate revisions by the same user not shown) | |||
| Line 1: | Line 1: | ||
[[Category:Site evaluation]] | [[Category:Site evaluation]] | ||
| + | <languages /> | ||
| + | <translate> | ||
| + | <!--T:1--> | ||
| + | [[File:Worldbankghi.png|thumb|right|Map of global horizontal irradiance (GHI) in kWh/m² which is equivalent to Peak Sun Hours (PSH). GHI does not account for tilt and azimuth of PV modules.<ref name="worldbank"> World Bank - Global Solar Atlas https://globalsolaratlas.info/map</ref>]] | ||
| + | |||
| + | <!--T:2--> | ||
| + | Temperature and [[Special:MyLanguage/Insolation|insolation]] largely determine the energy production of [[Special:MyLanguage/PV module|PV source]]. Temperature affects the performance of every component of an off-grid PV system, in almost all cases negatively. When designing an off-grid PV system the conditions under which a system will be operating will be factored into the design to make sure that the system can still deliver power when necessary even under the worst-case weather and solar resource conditions. | ||
| + | |||
| + | Information about the weather and solar resource for a location is most accurate when it is obtained from a nearby weather station that has many years of recorded data that can be analyzed at the level of days. Weather and solar resource can vary quite significantly from year to year and in the case of off-grid PV system design the months with the worst weather are the most important. Weather and solar resource data readily available on the internet, although there are print copies of this information for some locations. There is rarely local weather and solar resource data for remote locations where off-grid PV systems tend to be installed, which means that information must be used from the nearest site – which can be quite far away – or be obtained from an organization that provides estimates based upon computer models. There is no single definitive source for information that covers the entire globe and is available in many languages, although there are some resources that are close. These will be explored below. | ||
| + | |||
| + | <!--T:3--> | ||
| + | There are additional resources available see - [[Special:MyLanguage/Resources|Resources]] and the pages dedicated to specific countries. | ||
| + | |||
| + | ==Temperature== <!--T:4--> | ||
| + | |||
| + | <!--T:5--> | ||
| + | There are several important values that need to be determined to be able to properly design a PV system: | ||
| + | |||
| + | ====Maximum ambient temperature==== <!--T:6--> | ||
| + | |||
| + | <!--T:7--> | ||
| + | For [[Special:MyLanguage/PV source and charge controller sizing and selection overview|PV source and charge controller sizing and selection overview]], [[Special:MyLanguage/Wire, overcurrent protection, and disconnect sizing and selection|wire and overcurrent protection sizing and selection]], and [[Special:MyLanguage/Energy storage sizing and selection|energy storage sizing and selection]] it is necessary to have a maximum ambient temperature value in °C that these components are likely to be exposed to. It is not necessary to use the highest temperature ever recorded - the highest value during a multi-year period will suffice. The highest recorded temperature can be used, but may lead to the unnecessary oversizing of some system components. | ||
| + | |||
| + | ====Minimum ambient temperature==== <!--T:8--> | ||
| + | |||
| + | <!--T:9--> | ||
| + | For [[Special:MyLanguage/PV source and charge controller sizing and selection|PV source and charge controller sizing and selection]] it is necessary to have a minimum ambient temperature value in °C that these components are likely to be exposed to. It is not necessary to use the lowest temperature ever recorded - the lowest value during a multi-year period will suffice. The lowest recorded temperature can be used, but it is unlikely that the PV modules would see this temperature and be exposed to sunlight as low temperatures typically occur before sunrise. | ||
| + | |||
| + | ====Maximum indoor temperature==== <!--T:10--> | ||
| + | |||
| + | <!--T:11--> | ||
| + | For [[Special:MyLanguage/Wire, overcurrent protection, and disconnect sizing and selection|wire, overcurrent protection, and disconnect sizing and selection]] it is necessary to have a maximum indoor temperature in °C for the location where the system will be located. This will have to be an estimate decided upon by the system designer. | ||
| + | |||
| + | ====Minimum indoor temperature==== <!--T:12--> | ||
| + | |||
| + | <!--T:13--> | ||
| + | For [[Special:MyLanguage/Energy storage sizing and selection|energy storage sizing and selection]] it is necessary to have a minimum indoor temperature in °C for the location where the system will be located. This will have to be an estimate decided upon by the designer based upon how well the batteries are protected from low temperatures. Even if the batteries are in a space without heating, they are unlikely to experience the minimum ambient temperature as they have a high thermal mass that resists temperature changes. | ||
| + | |||
| + | ===Obtaining temperature data=== <!--T:14--> | ||
| + | |||
| + | <!--T:15--> | ||
| + | There are two recommended resources for obtaining weather data for sites: | ||
| + | |||
| + | ====PVGIS==== <!--T:16--> | ||
| + | |||
| + | <!--T:17--> | ||
| + | [https://re.jrc.ec.europa.eu/pvg_tools/en/#SA European Union - Photovoltaic Geographical Information System] A free and very detailed production modeling, system design tool and source for weather data that works in most locations globally. Also available in [https://re.jrc.ec.europa.eu/pvg_tools/es/#SA Spanish], [https://re.jrc.ec.europa.eu/pvg_tools/fr/#SA French], and [https://re.jrc.ec.europa.eu/pvg_tools/it/#SA Italian]. | ||
| + | |||
| + | <!--T:18--> | ||
| + | <gallery widths=250px> | ||
| + | PVGIStemp1.png|''(1)'' Select language ''(2)'' Select type of data - "TMY" (typical meteorological year). ''(3)'' Select the location using a name, GPS coordinates, or double-clicking somewhere on the map. ''(4)'' Select period - most recent is recommended. ''(5)'' Select "Dry bulb temperature." ''(6)'' Click "View!" to see the data. ''(7)'' For more detailed information, click ".csv" to export it as a spreadsheet. | ||
| + | PVGIStemp2.png|''(8)'' Determine the minimum ambient temperature by using your mouse to locate the lowest or one of the lowest temperatures on the graph. ''(9)'' Determine the maximum ambient temperature by using your mouse to locate to the highest or one of the highest temperatures on the graph. | ||
| + | </gallery> | ||
| + | |||
| + | ====NASA Power Data Viewer==== <!--T:19--> | ||
| + | |||
| + | <!--T:20--> | ||
| + | [https://power.larc.nasa.gov/data-access-viewer/ NASA - Power Data Viewer] A detailed global irradiance/meteorological resource provided by the National Aeronautics and Space Administration (NASA) that provides data globally. It is capable of exporting data sets and creating unique maps. Only available in English. | ||
| + | <gallery widths=200px> | ||
| + | NASAtemp1.png|''(1)'' Select "Daily."''(2)'' Select location on the map by clicking the pin (in red) or by entering GPS coordinates ''(3)'' Select period of time - a long period that is recent is ideal ''(4)'' Select data output type (only important if you intend to download the data) "ASCII" is a standard text document, "CSV" is a spreadsheet. | ||
| + | NASAtemp2.png|''(5)'' Select Minimum and Maximum Temperature at 2 meters under Meteorology (Temperature). ''(6)'' Click "Submit" | ||
| + | File:NASAtempmax.png|''(7)'' Select "Maximum Temperature at 2 meters. ''(8)'' This graph shows the maximum daily temperature during the selected time period. The red line has been added for emphasis. ''(9)'' This graph shows the frequency of various daily high temperatures during the selected time period. A maximum ambient temperature value should be chosen from this graph as well. | ||
| + | File:NASAtempmin.png|''(9)'' Select "Minimum Temperature at 2 meters. ''(10)'' This graph shows the minimum daily temperature during the selected time period. The red line has been added for emphasis. ''(11)'' This graph shows the frequency of various daily low temperatures during the selected time period. A maximum ambient temperature value should be chosen from this graph. | ||
| + | </gallery> | ||
| + | |||
| + | ==Solar resource== <!--T:21--> | ||
| + | |||
| + | <!--T:22--> | ||
| + | For the purpose of PV system design, the solar resource for a given location is expressed as [[Special:MyLanguage/Insolation|insolation in kWh/m²]]. The insolation value for a location will vary each day throughout the year. For the purpose of sizing the PV source for an off-grid PV system the most relevant value is the monthly average insolation value for a location as compared to the monthly average energy requirement - this process is covered in the [[Special:MyLanguage/Load and solar resource comparison|load and solar resource comparison]]. This value will be used to size the PV source to ensure that system can generate enough energy to meet the demands for all loads and to recharge the battery bank during periods of poor weather. It is very important to use a conservative insolation value for PV source sizing calculations. | ||
| + | |||
| + | <!--T:23--> | ||
| + | For determining the [[Special:MyLanguage/Energy storage sizing and selection#Step 2: Determine days of autonomy parameter|days of autonomy]] for a PV system it can be worthwhile to look at data that is even more detailed than monthly averages. There may be weeks in place like the Amazon rainforest, where it rains continuously for a week straight and the solar resource is very minimal. A system in a location like this may require a larger PV source, additional storage, or another form of power generation. | ||
| + | |||
| + | ===Obtaining solar resource data=== <!--T:24--> | ||
| + | |||
| + | <!--T:25--> | ||
| + | There are many different sources of solar resource data available - see [[Special:MyLanguage/Resources|Resources]] and the pages dedicated to specific countries. The most accurate measure of the solar resource in a given area is Global Horizontal Irradiance (GHI) that has been adjusted for the [[Special:MyLanguage/Tilt and azimuth|tilt and azimuth]] of the [[Special:MyLanguage/PV module|PV source]]. There are two good resources that for obtaining this particular data: | ||
| + | |||
| + | ====PVGIS==== <!--T:26--> | ||
| + | |||
| + | <!--T:27--> | ||
| + | [https://re.jrc.ec.europa.eu/pvg_tools/en/#SA European Union - Photovoltaic Geographical Information System] A free and very detailed production modeling, system design tool and source for weather data that works in most locations globally. Also available in [https://re.jrc.ec.europa.eu/pvg_tools/es/#SA Spanish], [https://re.jrc.ec.europa.eu/pvg_tools/fr/#SA French], and [https://re.jrc.ec.europa.eu/pvg_tools/it/#SA Italian]. | ||
| + | |||
| + | <!--T:28--> | ||
| + | <gallery widths=250px> | ||
| + | PVGISirradiance1.png|''(1)'' Select language ''(2)'' Select type of data - "Monthly Data". ''(3)'' Select location the using a name, GPS coordinates, or double-clicking. ''(4)'' and ''(5)'' Select start and end year - the longer period of time the better. ''(6)'' Select "Global irradiation at angle:" and enter the intended tilt angle of the PV source. ''(7)'' Click "Visualize results." ''(8)'' For more detailed information, click ".csv" to export it as a spreadsheet. | ||
| + | PVGISirradiance2.png|''(9)'' Navigate the graph using your mouse to determine the solar resource values. Use the values for each month when performing a [[Special:MyLanguage/Load and solar resource comparison|load and solar resource comparison]]. | ||
| + | </gallery> | ||
| + | |||
| + | ====PVWatts==== <!--T:29--> | ||
| + | |||
| + | <!--T:30--> | ||
| + | *[https://pvwatts.nrel.gov/ National Renewable Energy Laboratories - PVWatts Calculator] A free production modeling and system design tool from the National Renewable Energy Labs (NREL) that works in many areas around the world. Only available in English. | ||
| + | |||
| + | <!--T:31--> | ||
| + | <gallery widths=200px> | ||
| + | PVwatts1.png|''(1)'' Enter a location. ''(2)'' Click on "Go!" | ||
| + | PVwatts2.png|''(3)'' Make sure that there is a data source near the location. | ||
| + | PVwatts3.png|''(4)'' Verify that the location/data source are correct. ''(5)'' Click on "Go to system info." | ||
| + | PVwatts4-201207.png|''(6)'' Input 1kW system size. This will make PVWatts output the correct values for system design. ''(7)'' Leave as "Standard." ''(8)'' Leave as "Fixed (open rack)." ''(9)'' Set to "0" as system losses will be accounted for elsewhere. ''(10)'' Set to the desired [[Special:MyLanguage/Tilt and azimuth|tilt]]. ''(11)'' Set to the desired [[Special:MyLanguage/Tilt and azimuth|azimuth]]. ''(12)'' Click on "Go to PVWatts results." | ||
| + | PVwatts5.png|''(13)'' The average monthly insolation values - in red - can be used for the [[Special:MyLanguage/Load and solar resource comparison|load and solar resource comparison]]. The lowest monthly value is always of particular interest. | ||
| + | </gallery> | ||
| + | |||
| + | ==Notes/references== <!--T:32--> | ||
| + | <references/> | ||
| + | </translate> | ||
Latest revision as of 13:59, 31 March 2021

Temperature and insolation largely determine the energy production of PV source. Temperature affects the performance of every component of an off-grid PV system, in almost all cases negatively. When designing an off-grid PV system the conditions under which a system will be operating will be factored into the design to make sure that the system can still deliver power when necessary even under the worst-case weather and solar resource conditions.
Information about the weather and solar resource for a location is most accurate when it is obtained from a nearby weather station that has many years of recorded data that can be analyzed at the level of days. Weather and solar resource can vary quite significantly from year to year and in the case of off-grid PV system design the months with the worst weather are the most important. Weather and solar resource data readily available on the internet, although there are print copies of this information for some locations. There is rarely local weather and solar resource data for remote locations where off-grid PV systems tend to be installed, which means that information must be used from the nearest site – which can be quite far away – or be obtained from an organization that provides estimates based upon computer models. There is no single definitive source for information that covers the entire globe and is available in many languages, although there are some resources that are close. These will be explored below.
There are additional resources available see - Resources and the pages dedicated to specific countries.
Temperature
There are several important values that need to be determined to be able to properly design a PV system:
Maximum ambient temperature
For PV source and charge controller sizing and selection overview, wire and overcurrent protection sizing and selection, and energy storage sizing and selection it is necessary to have a maximum ambient temperature value in °C that these components are likely to be exposed to. It is not necessary to use the highest temperature ever recorded - the highest value during a multi-year period will suffice. The highest recorded temperature can be used, but may lead to the unnecessary oversizing of some system components.
Minimum ambient temperature
For PV source and charge controller sizing and selection it is necessary to have a minimum ambient temperature value in °C that these components are likely to be exposed to. It is not necessary to use the lowest temperature ever recorded - the lowest value during a multi-year period will suffice. The lowest recorded temperature can be used, but it is unlikely that the PV modules would see this temperature and be exposed to sunlight as low temperatures typically occur before sunrise.
Maximum indoor temperature
For wire, overcurrent protection, and disconnect sizing and selection it is necessary to have a maximum indoor temperature in °C for the location where the system will be located. This will have to be an estimate decided upon by the system designer.
Minimum indoor temperature
For energy storage sizing and selection it is necessary to have a minimum indoor temperature in °C for the location where the system will be located. This will have to be an estimate decided upon by the designer based upon how well the batteries are protected from low temperatures. Even if the batteries are in a space without heating, they are unlikely to experience the minimum ambient temperature as they have a high thermal mass that resists temperature changes.
Obtaining temperature data
There are two recommended resources for obtaining weather data for sites:
PVGIS
European Union - Photovoltaic Geographical Information System A free and very detailed production modeling, system design tool and source for weather data that works in most locations globally. Also available in Spanish, French, and Italian.
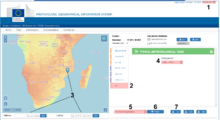
(1) Select language (2) Select type of data - "TMY" (typical meteorological year). (3) Select the location using a name, GPS coordinates, or double-clicking somewhere on the map. (4) Select period - most recent is recommended. (5) Select "Dry bulb temperature." (6) Click "View!" to see the data. (7) For more detailed information, click ".csv" to export it as a spreadsheet.
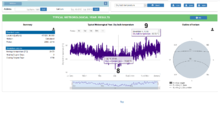
(8) Determine the minimum ambient temperature by using your mouse to locate the lowest or one of the lowest temperatures on the graph. (9) Determine the maximum ambient temperature by using your mouse to locate to the highest or one of the highest temperatures on the graph.


NASA Power Data Viewer
NASA - Power Data Viewer A detailed global irradiance/meteorological resource provided by the National Aeronautics and Space Administration (NASA) that provides data globally. It is capable of exporting data sets and creating unique maps. Only available in English.
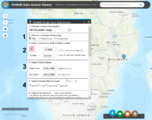
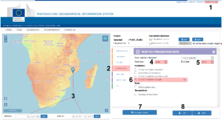
(1) Select "Daily."(2) Select location on the map by clicking the pin (in red) or by entering GPS coordinates (3) Select period of time - a long period that is recent is ideal (4) Select data output type (only important if you intend to download the data) "ASCII" is a standard text document, "CSV" is a spreadsheet.
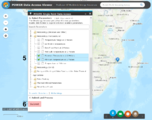
(5) Select Minimum and Maximum Temperature at 2 meters under Meteorology (Temperature). (6) Click "Submit"
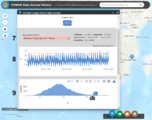
(7) Select "Maximum Temperature at 2 meters. (8) This graph shows the maximum daily temperature during the selected time period. The red line has been added for emphasis. (9) This graph shows the frequency of various daily high temperatures during the selected time period. A maximum ambient temperature value should be chosen from this graph as well.
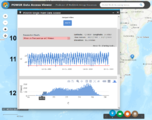
(9) Select "Minimum Temperature at 2 meters. (10) This graph shows the minimum daily temperature during the selected time period. The red line has been added for emphasis. (11) This graph shows the frequency of various daily low temperatures during the selected time period. A maximum ambient temperature value should be chosen from this graph.


Solar resource
For the purpose of PV system design, the solar resource for a given location is expressed as insolation in kWh/m². The insolation value for a location will vary each day throughout the year. For the purpose of sizing the PV source for an off-grid PV system the most relevant value is the monthly average insolation value for a location as compared to the monthly average energy requirement - this process is covered in the load and solar resource comparison. This value will be used to size the PV source to ensure that system can generate enough energy to meet the demands for all loads and to recharge the battery bank during periods of poor weather. It is very important to use a conservative insolation value for PV source sizing calculations.
For determining the days of autonomy for a PV system it can be worthwhile to look at data that is even more detailed than monthly averages. There may be weeks in place like the Amazon rainforest, where it rains continuously for a week straight and the solar resource is very minimal. A system in a location like this may require a larger PV source, additional storage, or another form of power generation.
Obtaining solar resource data
There are many different sources of solar resource data available - see Resources and the pages dedicated to specific countries. The most accurate measure of the solar resource in a given area is Global Horizontal Irradiance (GHI) that has been adjusted for the tilt and azimuth of the PV source. There are two good resources that for obtaining this particular data:
PVGIS
European Union - Photovoltaic Geographical Information System A free and very detailed production modeling, system design tool and source for weather data that works in most locations globally. Also available in Spanish, French, and Italian.
(1) Select language (2) Select type of data - "Monthly Data". (3) Select location the using a name, GPS coordinates, or double-clicking. (4) and (5) Select start and end year - the longer period of time the better. (6) Select "Global irradiation at angle:" and enter the intended tilt angle of the PV source. (7) Click "Visualize results." (8) For more detailed information, click ".csv" to export it as a spreadsheet.
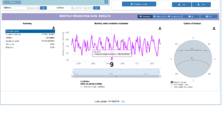
(9) Navigate the graph using your mouse to determine the solar resource values. Use the values for each month when performing a load and solar resource comparison.


PVWatts
- National Renewable Energy Laboratories - PVWatts Calculator A free production modeling and system design tool from the National Renewable Energy Labs (NREL) that works in many areas around the world. Only available in English.
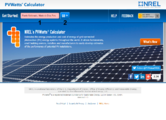
(1) Enter a location. (2) Click on "Go!"
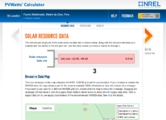
(3) Make sure that there is a data source near the location.
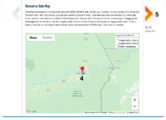
(4) Verify that the location/data source are correct. (5) Click on "Go to system info."
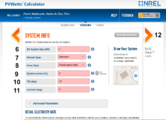
(6) Input 1kW system size. This will make PVWatts output the correct values for system design. (7) Leave as "Standard." (8) Leave as "Fixed (open rack)." (9) Set to "0" as system losses will be accounted for elsewhere. (10) Set to the desired tilt. (11) Set to the desired azimuth. (12) Click on "Go to PVWatts results."
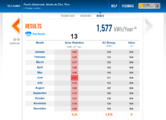
(13) The average monthly insolation values - in red - can be used for the load and solar resource comparison. The lowest monthly value is always of particular interest.


Notes/references
- ↑ World Bank - Global Solar Atlas https://globalsolaratlas.info/map